We show not only the result of SEO work, but the process itself — from audit to report.
This page shows how the work inside our “SEO promotion and ongoing support” service is organized: the six steps of one cycle, and what we mean by “transparency” in practice.
Audit and inventory (Step 1 of 6)
A full audit is not just a technical checklist. It’s an inventory of everything already on the site: pages, the queries it can rank for, intent overlaps between sections, and the state of indexing. We record what already works, what’s getting in the way, and where the coverage gaps are — this is the entry point of the cycle: “Diagnostics” and “Keyword research” from the service page.
It’s the same principle we use to build the architecture of both our own site and client projects: before deciding what to do with a page, we check whether an existing page already covers the query it would target.
If there hasn’t been an audit yet, we start with one: start with an SEO audit.
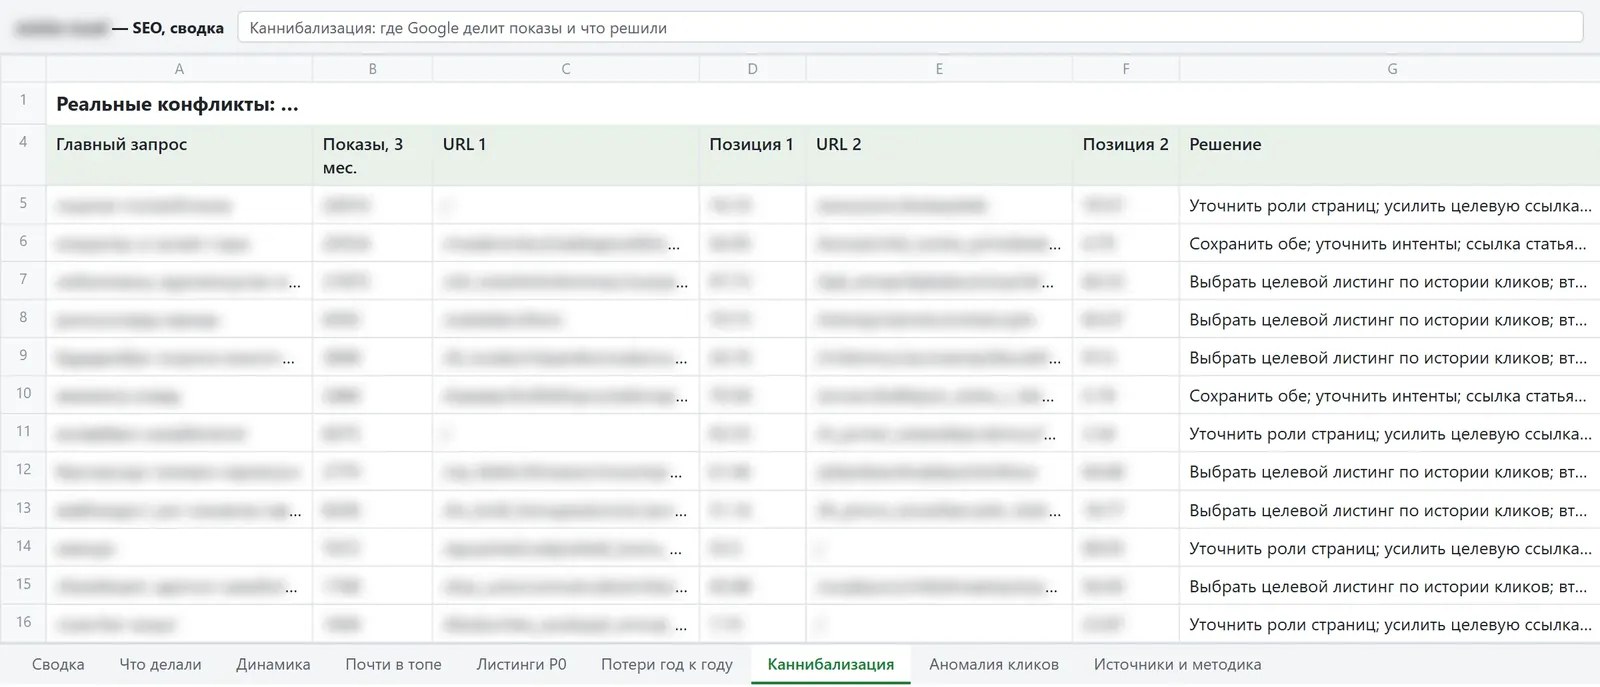
SEO status table (Step 2 of 6)
The result of the audit and ongoing work comes together in one working table — not a slide deck once a month, but a summary you can open and look at: KPIs with a noise threshold, so a random fluctuation isn’t mistaken for a signal, plus a prioritized list of hypothesis-tasks.
This is one of our reporting formats, not a single template that’s the same for every client.
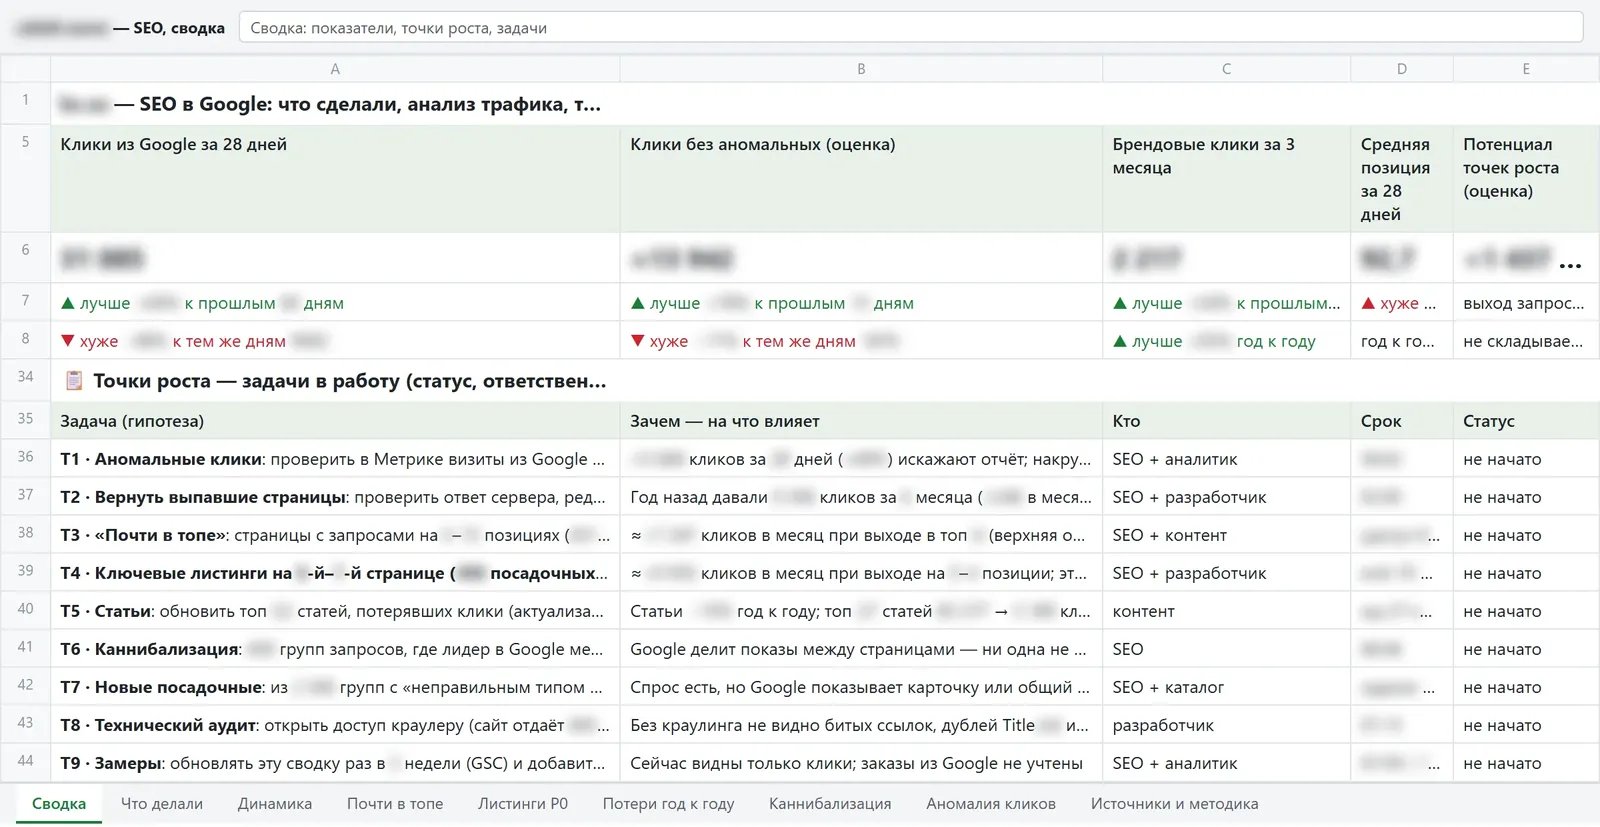
Hypotheses with priority and expected effect (Step 3 of 6)
Every task in the table is a hypothesis: why it’s needed, what it affects, and what priority it has. We don’t frame it as “do something” but as “if we do X, we expect Y, because Z” — the logic of the hypothesis is visible, not just a to-do list.
A typical source of hypotheses is pages close to the top of search results: a small change there can produce a noticeable effect.
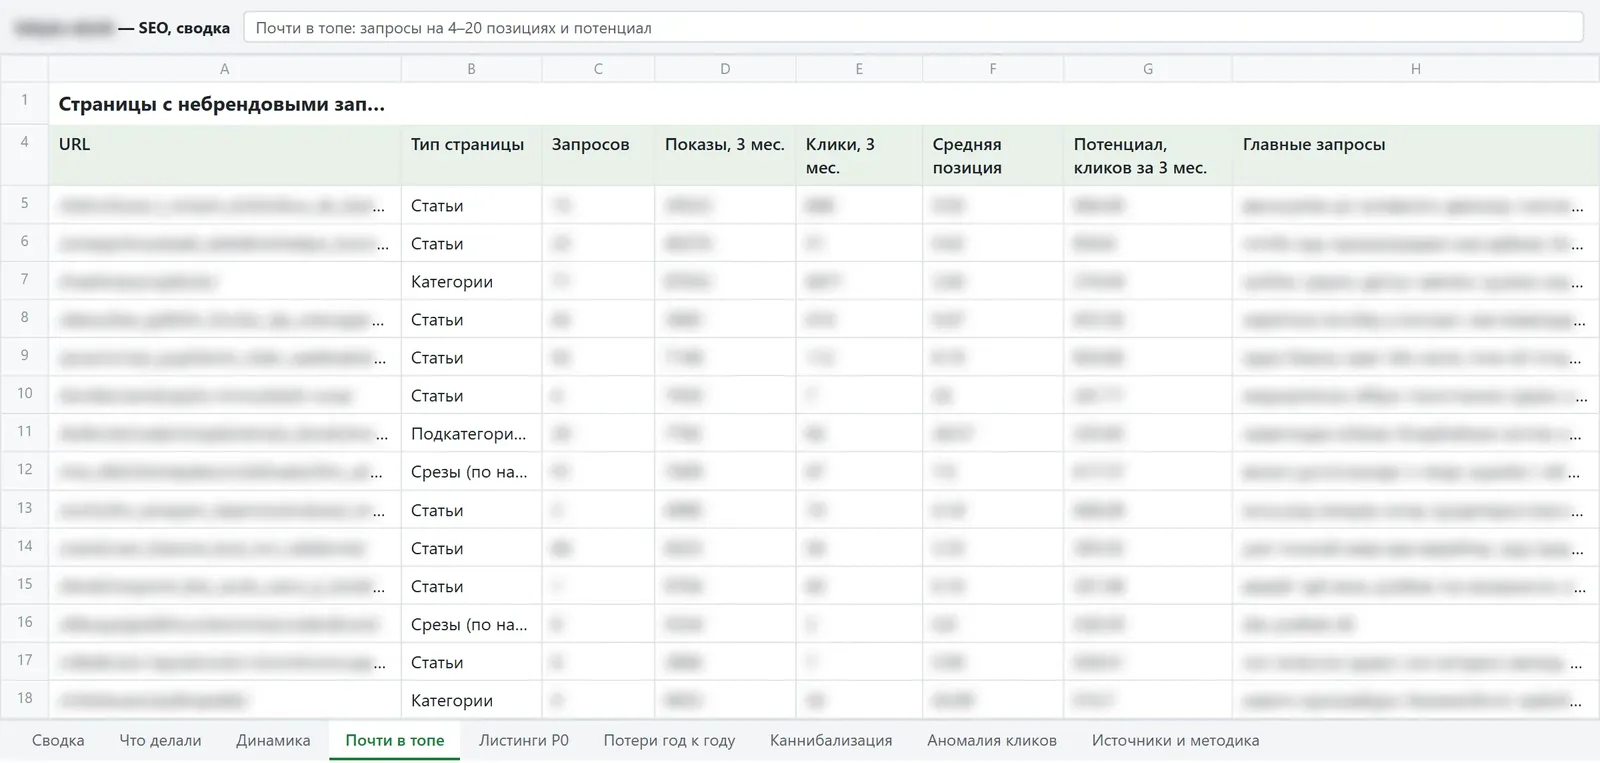
Test: we implement only after approval (Step 4 of 6)
A hypothesis becomes a change on the site only after approval — especially if it’s risky: deleting or merging pages, publishing, and other risky changes. Every approved change is logged in the work log: the date, what was done and at what scale — an example of this log is further below, in the “Full transparency” section. This way, measuring the result is tied to a specific action, not to an arbitrary date.
Measurement: before and after, accounting for noise and anomalies (Step 5 of 6)
We compare comparable periods before and after implementation, not a single day, so the result isn’t mistaken for an ordinary fluctuation.
The noise threshold is the boundary below which a fluctuation in clicks or position doesn’t count as a signal (you can see this on the screenshot above, in the “Summary” sheet). Anomalies — sharp spikes or drops not caused by our changes (seasonality, outages, external events) — are excluded from the trend where possible, rather than being presented as a result.
We check the result against the agreed reporting schedule.
Report and plan revision (Step 6 of 6)
Based on the measurement results, the plan for the next cycle is revised: some hypotheses are confirmed, some are dropped, and new tasks are added by priority — we revise the plan as the site and demand change.
This is ongoing work, not a one-off task — part of the “SEO promotion and ongoing support” service.
Full transparency
Transparency isn’t just a word on this page — it’s something you can actually see and check. Below is exactly what we mean by it.
Access to the table
The SEO status table isn’t a box-ticking report once a quarter — it’s a working document available to you, not just to us.
Work log
What was done, when, at what scale, why, and where to check the result — kept as the work happens, not reconstructed afterward.
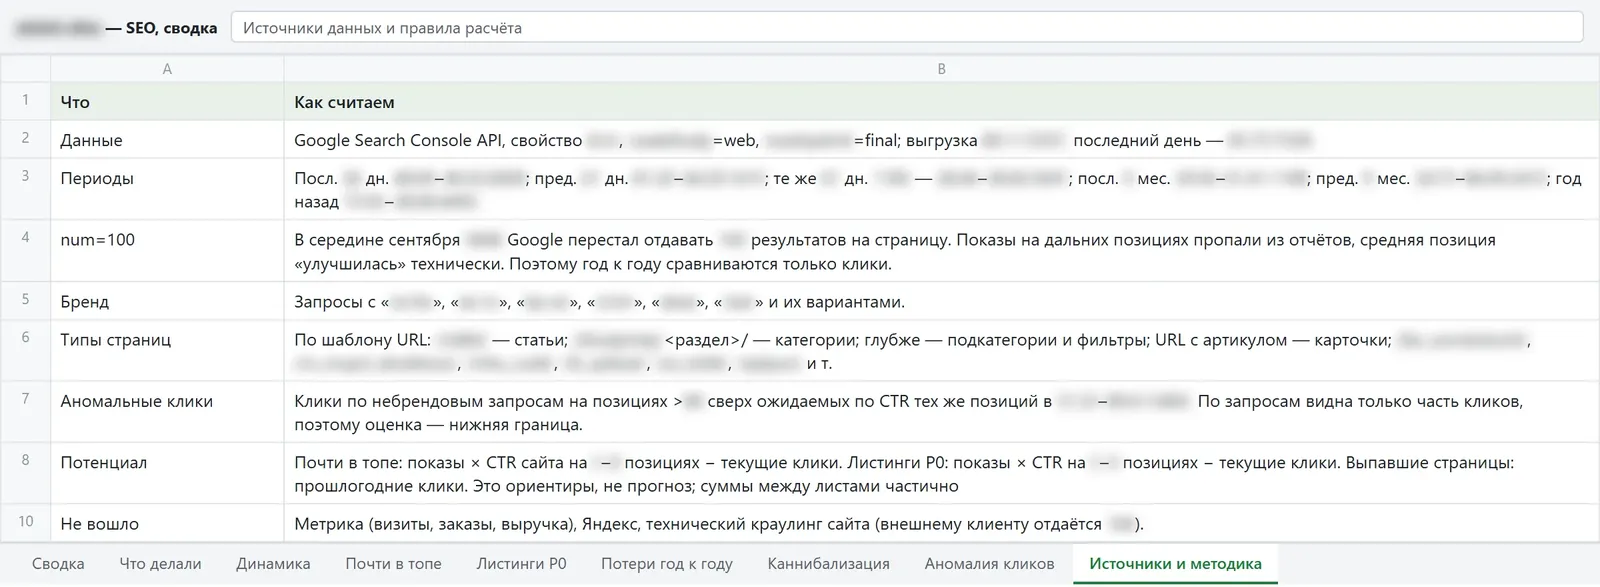
Sources and calculation rules
Where the data comes from, for which periods, and how brand, anomalies and potential are calculated — no “black box” in the formulas.
Honest data limitations
Not everything can be measured perfectly: seasonality, the limitations of the analytics systems themselves, gaps in historical data — we say this plainly instead of hiding it.
No ranking guarantees
We show the process and what’s been done; we don’t guarantee rankings or timelines — they’re affected by demand, competitors and search engine algorithms.
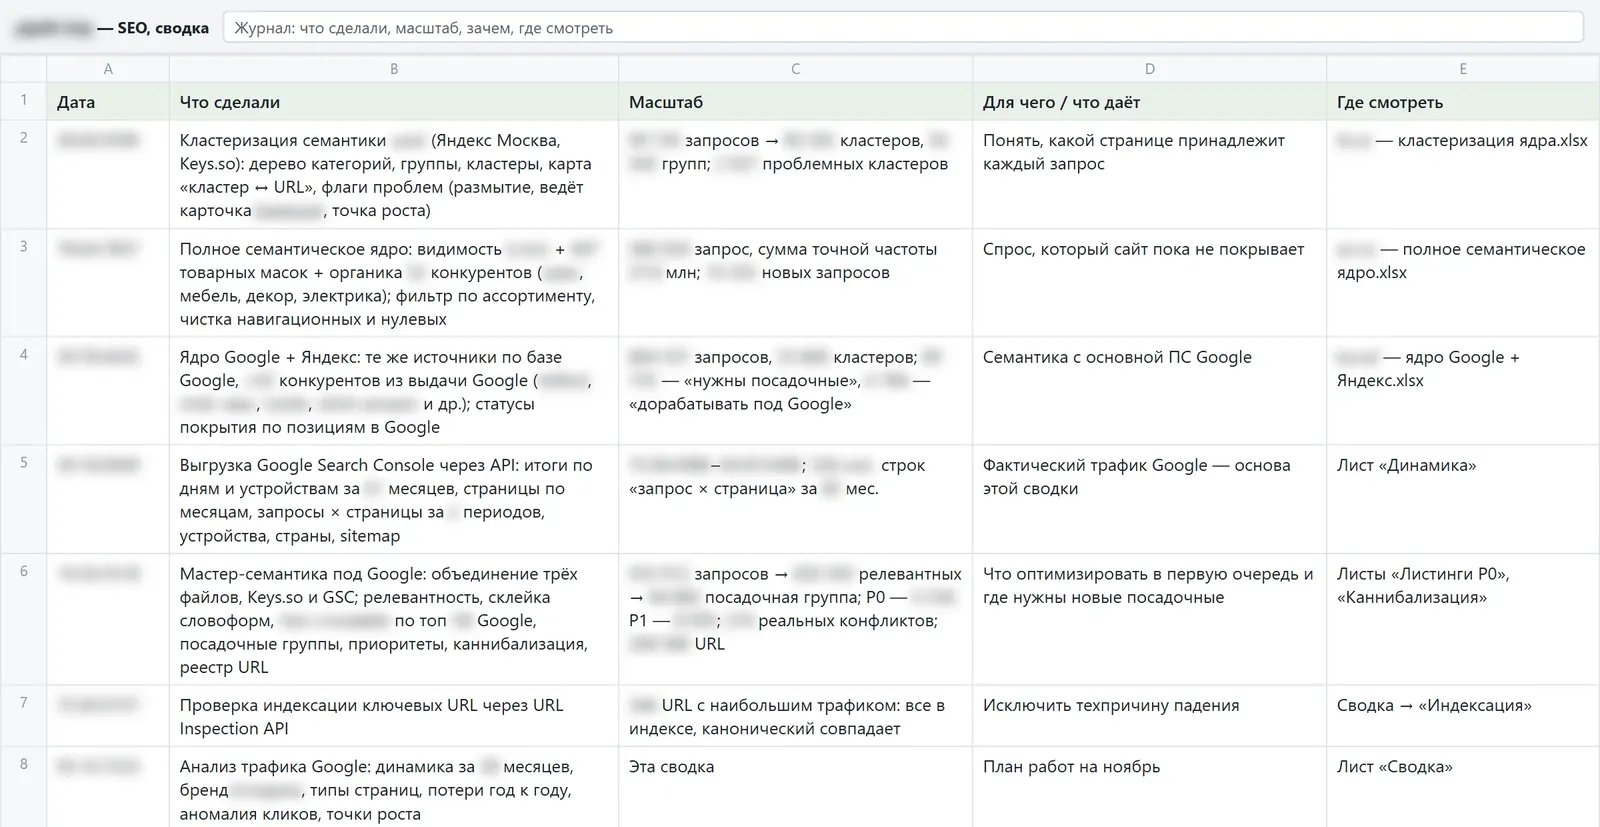
Next step
Want to see how this works on your site?
Tell us about your site and your task: Discuss your project. If you’re not yet sure which direction to start with: Start with an SEO audit.
- We don’t guarantee rankings or timelines: they’re affected by demand, competitors and search engine algorithms.
- We use sustainable SEO methods — no manipulative tactics, hidden schemes or mass spam.
- Deleting and merging pages, publishing and other risky changes — only after your approval.